Introduction
The World Health Organisation defines HCV as a liver disease caused by Hepatitis C virus: A virus that can potentially cause both acute and chronic hepatitis, with severity that ranges from mild illness lasting only a few weeks to a lifelong illness (WHO, 2011). Antiviral medicines can cure more than 95% of persons with Hepatitis C infection thereby reducing the risk of death from cirrhosis and liver cancer, but access to diagnosis and treatment is low and there is currently no effective vaccine against hepatitis C (WHO, 2015). Egypt has the highest rate of Hepatitis C in the world (Guerra et al., 2012). Nearly 4.4 per cent of adult Egyptians are infected and about 40,000 die of the disease every year. (World bank, 2017). The most common HCV genotype in Egypt is genotype 4, which accounts for 85% of total HCV cases (Elgharably et al., 2012).
Currently, the primary treatment option for HCV is pegylated interferon and ribavirin (PIR) whose success in achieving Sustained Virologic Response (SVR) is ~40% for individuals with genotype 4. Ledipasvir and Sofosbuvir is an antiviral treatment combination that is relatively effective across all genotypes with 90% of SVR and fewer side effects but at much higher costs (Kendeel et al., 2017). In a bid to lower the costs of this treatment, the Egyptian Government has negotiated a probable 90% discount (Discussions not yet officially finalised) from EGP400,000 to EGP40,000. The Egyptian Government has thus requested for a Cost Effectiveness Analysis to compare the existing treatment intervention (Pegylated Interferon and Ribavirin (PIR) with the new one; Ledipasvir and Sofosbuvir (LS) to help them make an informed decision.
A Cost Effectiveness Analysis (CEA) is used because it is useful for identifying interventions which offer large health gains in relation to their costs to warrant adoption and is based on the comparative assessment of costs and benefits, with benefits focusing on health gains (Drummond et al., 2015). Cost Effectiveness Threshold (CETs) based on opportunity costs, describes the amount of money that, if removed from the healthcare system, would result in one less unit of health being generated, or equivalently, the cost of generating health in the current system. To express CEA results, incremental cost effectiveness ratios (ICER) is used. This refers to the ratio of the difference in costs to the difference in effects between two treatments. (Woods et al., 2016; Drummond et al., 2015)
Methods
Model structure
A Markov model developed on excel was used to compare cost effectiveness of PIR and LS, to simulate the different health transition states of a cohort of individuals with HCV through a lifespan. Previous studies have shown that this model is useful for chronic conditions like HCV because it allows for synthesis of data on costs, effects, health related quality of life, evaluation of several health states over a specific defined time period and takes dependent variables into account (Buxton et al., 1997)
Figure 1: Markov Model Schematic
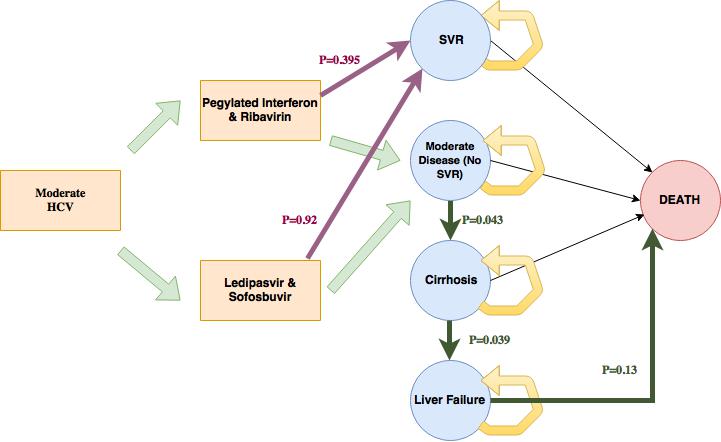


FIG 1: Markov model schematic showing the transition states
(Fig 1). The model was simulated equally between 2000 people for LS and PIR who both begun at cycle 0. It is assumed that both treatment regimens were for a period of 6 months with population of interest being people having genotype 4 with moderate disease and whose average age is 40 years. In cycle 0, people are treated with either PIR or LS for a period of 6 months and either achieve SVR or remain in moderate state. People in SVR were assumed to incur no further costs and cannot be re-infected with HCV. The cycles are such that people who are non-responsive to treatment (No SVRs) continue to have moderate disease and could either progress to Liver Cirrhosis or to liver failure or all-cause mortality. From the health states prior to liver failure, patients are assumed to face the same risk of all-cause mortality in addition to facing an excess risk of death due to their liver disease. The model assumes that no further drug treatment options are available for people who do not achieve SVR and that there was no disutility during the antiviral treatment
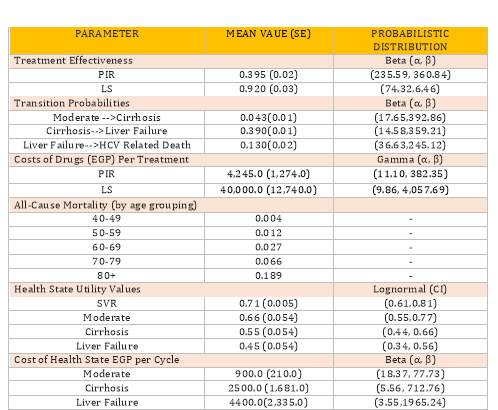
The data presented in Table 1 belowwasprovidedby the Egyptian government.
Due to the absence of local utility valuations, values were derived from a survey of UK patients at different disease stages who completed a Euroqol questionnaire. (EQ-5D-3L). (These are further discussed in the limitations.)
Viewpoint Adopted
As recommended by the Gates refence case guidelines, going by the health services perspective was used in this case. (Claxton et al., 2014) The information provided by the Egyptian government pointed to the fact that costs other than the direct healthcare costs were not readily available and I justified the audience of this report using the kind of data given for the assessment to be conducted.
Time Horizon
The model applied 34 cycles and a life expectancy of 75 years. The government negotiations for a discounted price are ongoing. This model has thus assumed the figures bearing the likelihood of obtaining a successful negotiation in mind. (Murphy et al., 2006)
Table 1: A table displaying summary of parameter values used in the Markov model and their measurements used.
Outcome measure
Quality Adjusted Life Years (QALYs) are useful in measuring the Quality of Life (QoL) and disease burden. They are calculated by adjusting the time spent in a particular disease state by the utility weight of that state. (NICE, July 2009) which were the outcome measures for this model were unavailable for Egypt and thus, values derived from a survey of UK patients at different disease stages and who completed a Euroqol (EQ-5D-3L) were used. Utility weights were incorporated to consider how the different treatment options. Patients with HCV have lower QoL of life than the general population which is further reduced when they transition to Cirrhosis state.
Discounting
A rate of 3.5% discount was applied to costs and outcomes per year as per the Egyptian guidelinesto account for diminishing marginal utility, coupled with the expectation that in the future that will make consumption higher. (Brouwer et al., 2001, Page 114-118)
Sensitivity Analyses
One Way Analysis (Deterministic Sensitivity Analysis (DSA)
To address methodological uncertainty, time horizon is extended to 75 years of age and 36 cycles (reflecting old age and until everyone in the model dies), and discounting rates are varied between 2% and 6%, as per Egyptian reporting guidelines (Fox-Rusby et al, 2005). Costs were discounted using 2015 and 2018 rates. ** Additionally, the uncertainty regarding the discount was analysed, using a cost of 400,000 EGP for LS. Alternative treatment assumptions were tested in two further analyses, one being treating with PIR and LS in every cycle, and one being treating everyone with PIR in every cycle, but only once with LS. Disease state transition probabilities, QoL weights and costs, and treatment effectiveness and costs. 95% confidence intervals (C.Is) were used to test how sensitive the ICER was to the given parameter, as recommended. The point parameters used in this analysis were: probabilities of disease transitions and QoL weights and costs. The sensitivity of ICER to a given parameter was tested by calculating Confidence Intervals (Upper and lower boundaries of the 95% C.I).
Probabilistic Sensitivity Analysis (PSA)
PSA enables us to address parametric uncertainties simultaneously. All of the parameters in this model were sampled from their parametric distributions. Transition states and treatment effectiveness were assigned Beta distributions as they are bounded by 0 and 1, Quality of Life Weights were assigned lognormal because they are bounded by 1 but could be less than 0, and costs as gamma distributions as they cannot be negative. Gamma distribution was used for cost parameters to account for skewness of cost data. I conducted 1000 stochastic simulations and calculated a cost effectiveness analysis aimed to address sampling uncertainties around mean estimates that allowed varying of the parameters in the model simultaneously and show the probability that a given strategy would be cost effective at various willingness to pay thresholds. Lifelong extension was applied because there is sufficient evidence to indicate that the treatment offers life extension, normally at least additional 3 months.
Base Case Results
Table 2: Summary of results of outcomes and costs for PIR and LS. The base case ICER value was EGP 11,932/QALY
. 
Deterministic Sensitivity Analysis Results.
Below is a tornado diagram that shows how input parameters affected the overall ICER. Probability of LS in achieving SVR and QoL weight for one cycle in moderate state were parameters the model was most sensitive to. Using lower CI range increases ICER to EGP 126,28334. This pointed out to the need for focus using research in this area to have a better certain estimate of QoL weight for one cycle in moderate state. The model was robust to the following parameters: Probabilities to transition from cirrhosis to Liver Failure, Liver failure to death, cirrhosis to Liver failure and cost of a moderate disease cycle.
Figure 2 Tornado Diagram
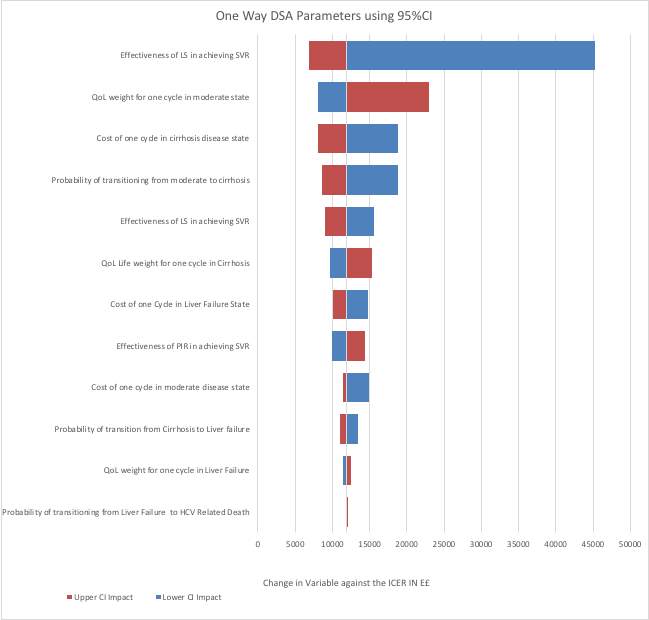
The results of the model’s sensitivity to alternative assumptions showed a decrease in the ICER upon extending the time horizon in the model to 101 years old and implying that choosing a longer time horizon could mean reaping more benefits captured from the initial cost. Smaller ICERS aren’t recommended for use in decision making because the likelihood of living till 101 years old is quite rare which is what the model depicts as the time everyone will have died or all costs and outcomes of the treatment will have been accounted for. Using this time zone can be misleading though it captures more outcomes from LS rather than using life expectancy in this case.LS also demonstrates a higher ICER compared to base case which can be interpreted as the most cost-effective treatment option being once at point 0. Treating patients at every cycle is unlikely to reap significant outcomes in comparison to the base case scenario.
Probabilistic sensitivity analysis Results
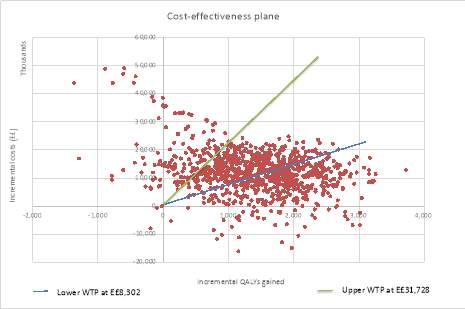
Distributions for the parameters of the model were chosen and values selected from each of the distributions randomly. The resultant base ICER after running 1000 simulations was too high at 14,470,868. The costs and life years associated with each option were then evaluated. The process was repeated 1000 times and the results plotted on the CE plane shown below in Fig 3. The results clustering of points in the North East Quadrant on the cost effectiveness plane suggested that for majority of the simulations, LS is more effective and pricier compared with PIR. The dots on the North West side of the plane (usually favouring the existing treatment) indicates some uncertainty on whether LS is cost effective.
Figure 3: A Cost effectiveness plane showing incremental QALYs gained plotted against incremental costs.
Discussion
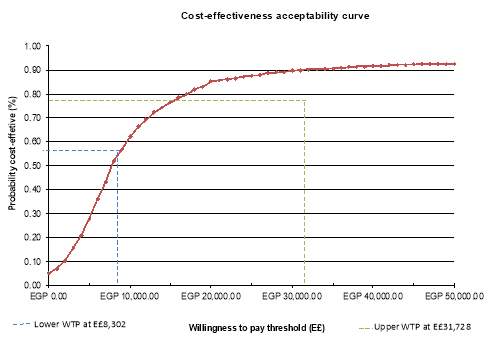
The aim of this report is to compare cost effectiveness of adopting LS vis a vis PIR which is the existing treatment method. The first step to answering this is by calculating a cost effectiveness threshold. (WHO Choice method; Woods et al., 2016) argued for the use of opportunity costs to estimate a CET range for Egypt. I used the midpoint between previous WHO and Woods et al methodologies estimate of EGP 82,810 and EGP 21,586. The LS cost falls below this thresh hold and therefore, suggests that LS is cost effective at 78% and 68% of the corresponding
Figure 4: Cost Effectiveness Acceptability Curve showing Willingness to Pay Thresholds in Egypt.
Limitations of the assessment.
There are several limitations to using a markov model for analysis. Structurally, Markov model assumes that transition probabilities are constant over time which might not often be accurate especially in the case of limited data. The ICER as a ratio statistic poses particular problems for confidence interval estimation since a non-negligible probability on the neighbourhood of zero on the denominator makes a formula for variance of the ICER intractable. (Brouwer et al, 2001, page 179)The results obtained from this study were obtained from a single-arms (non-randomised) comparison across different RCTs which is limiting as a meta-analysis of RCTs should have been used instead for better detailed findings. The utility values from which QALYs were calculated were derived from a survey of UK patients at different disease stages which could lead to an overestimation because of the difference in the country’s classification. Egypt is a lower Middle-Income country (World Bank, 2019) and therefore a country of similar proximity should have been used instead of those from a high-income country. (UK). An additional meta-analysis of relevant non-health costs and outcomes would be useful to decision makers. The cost data with direct costs is single-handedly inadequate for an analysis of such nature.
Several assumptions have limited this model as follows: First, it is rather inaccurate to assume that the adherence levels of people on PIR and LS would be the same considering that it is already known that PIR has known side effects like diarrhoea and vomiting. Incorporating disutility weights which would have resulted in a smaller ICER, leading to an increase in cost effectiveness of LS. (El Sisi et al.,2013). Assuming lengths of treatment would be equal for PIR and LS is arguable because LS treatment is usually much shorter than PIR (Gomaa et al, 2017).Not clearly expressing HCC and decompensated cirrhosis as separate health states limits the validity of the model and incorrectly assumes a similarity in transition to death for both of the conditions.
Failure to examine treatment effectiveness in both arms of the group despite high genotype 4 prevalence constrained the study. In order to achieve heterogeneity, the population should be clustered into subgroups like onset, virus, genotype, public vs private insurance, region etc and a stratified analysis carried out to ascertain the differences in cost effectiveness between the sub clusters. This would improve results generalisability which is currently constrained due to existence of regional differences, healthcare practises and treatment accessibility in the prevalence of HCV. (El Sisi et al.,2013)
Conclusion
In view of the arguments made above, the results obtained suggest that implementing LS treatment intervention for people with HCV in Egypt is likely to be cost effective in comparison to the existing intervention (PIR especially given failure of PIR. Research on societal perspectives would be beneficial for the HCV program to succeed.
This, however, is subject to multiple factors such as successful negotiation of the discount by the Egyptian government, budget impact analysis study, other pressing public health priorities competing for government resources and what Cost Effectiveness Threshold set by Egypt. To bridge the knowledge gap, research on factors such as treatment effectiveness and utility weights would go a long way in improving the quality of the study.
References
- Buxton MJ, Drummond MF, Van Hout BA, Prince RL, Sheldon TA, Szucs T, Vray M. (1998) Modelling in Ecomomic Evaluation: An Unavoidable Fact of Life. Health Economics. 6(3):217-227. DOI: 10.1002/(SICI)1099-1050(199705)6:33.0.CO;2-W
- (worldbank.org/curated/en/164381517333701631/Eliminating-Hepatitis-C-from-Egypt-2017-update-on-current-trends-and-policyrecommendations-policy-brief)
- Claxton KP, Revill P, Sculpher M, Wilkinson T, Cairns J, Briggs A. (2014) The Gates Reference Case for Economic Evaluation: The Bill and Melinda Gates Foundation.
- Brouwer W, Rutten F, Koopmanschap M (2001) Costing in economic evaluations, chapter 4 in Drummond M, McGuire A (eds.) Economic Evaluation in Health Care: Merging theory with practice, Oxford University Press pp68-93.
- Drummond MF, Sculpher, MJ, Claxton K, Stoddart GL, Torrance GW. (2015) Methods for the Economic Evaluation of Health Care Programmes (4th edition): Oxford University Press
- El Sayed N, Kandeel A, Genedy M. (2012) Progress Toward Prevention and Control of Hepatitis C Virus Infection – Egypt, 2001–2012. Morbidity and Mortality Weekly Report. 61(29):556–560. DOI: 10.1001/jama.300.14.1643
- Elgharably A, Gomaa AI, Crossey MME, Norsworthy PJ, Waked I, Taylor-Robinson SD. (2017) Hepatitis C in Egypt – past, present, and future. International Journal of General Medicine. 10:1-6. DOI: 10.2147/IJGM.S119301
- Elsisi GH, Kaló Z, Eldessouki R, Elmahdawy MD, Saad A, Ragab S, Elshalakani AM, Abaza S. (2013) Recommendations for Reporting Pharmacoeconomic Evaluations in Egypt. Value in Health Regional Issues. 2(2):319-27.
- Fox-Rusby J, Cairns J. (2005) Economic Evaluation. Maidenhead: Open University Press
- Gomaa A, Allam N, Elsharkway A, El Kassas M, Waked I. (2017) Hepatitis C infection in Egypt: prevalence, impact and management strategies. Hepatic Medicine: Evidence and Research. 9:17-25. DOI: 10.2147/HMER.S113681
- Guerra J, Garenne M, Mohamed, MK, Fontanet A. (2012) HCV burden of infection in Egypt: Results from a nationwide survey. Journal of Viral Hepatitis. 19(8): 560-567 DOI: 10.1111/j.1365-2893.2011.01576.x
- Kandeel A, Genedy M, El-Refai S, Funk AL, Fontanet A, Talaat M. (2017) The prevalence of hepatitis C virus infection in Egypt 2015: implications for future policy on prevention and treatment. Liver International. 37(1):45-53. DOI: 10.1111/liv.13186
- Murphy KM, Robert TH. (2006) The Value of Health and Longevity. Journal of Political Economy, 114(5):871-904. DOI: 10.1086/508033
- WHO. (2003). Making Choices in Health: WHO Guide to Cost-Effectiveness Analysis, (Tan-Torres Edejer TBaltussen RAdam THutubessy RAcharya AEvans DBMurray CJL, eds). Geneva: World Health Organization.
- WHO. (2011) WHO | Hepatitis C. WHO Fact Sheet.
- WHO. (2015) Hepatitis C, Fact sheet n°164. Hepatitis C. https://doi.org/http://dx.doi.org/10.1016/S0140-6736(14)62401-6
- Woods B, Revill P, Sculpher M, Claxton K. (2016) Country-Level Cost-Effectiveness Thresholds: Initial Estimates and the Need for Further Research. Value Health. 19(8):929-935. DOI: 10.1016/j.jval.2016.02.017
- Turner HC, Lauer JA, Tran BX, Teerawattananon Y, Jit M. Adjusting for Inflation and Currency Changes Within Health Economic Studies. Value Health. 2019 Sep;22(9):1026-1032. DOI: 10.1016/j.jval.2019.03.021.
- Brouwer W, van Hout, B and Rutten, F. (2000) A fair approach to discounting future effects: taking a societal perspective. J. Health Serv. Policy, 5,114-18.
- World Bank. (2015) GDP per capita (current LCU) [online] Available from: https://data.worldbank.org/indicator/NY.GDP.PCAP.CN?end=2015&start=1960
- XE. (2015) XE Currency Charts: USD to EGP. [Online] Available on: http://www.xe.com/currencycharts/?from=USD&to=EGP&view=5Y
Cite This Work
To export a reference to this article please select a referencing style below:
Related Content
All TagsContent relating to: "hepatitis"
Hepatitis, one of the major incurable diseases, still exists nowadays endangering many people’s lives. It has many types i.e. Hepatitis A, B, C, D, E and G. The nature of Hepatitis is viral which is caught by either through body fluids or improper personal hygiene in addition to other causes which remains unknown.
Related Articles


