The general overview of project is to create a program using MATLAB to detect changes in Electrocardiogram’s (ECG) when a patient is experiencing a heart attack and be able to potentially identify the type of heart attack that is being experienced. This progress in the ECG diagnosis is to help aid doctors in the treatment of the heart attack to help reduce the mortality rates. Heart attacks come in many different forms and can occur in different areas of the heart. Due to this essentially an ECG should react differently depending on the area of the heart that is affected this is due to the fact that the different stages of the ECG represent different electrical points of significance which correlate to mechanical events in the heart. Currently a doctor must analyse the ECG and using fluoroscopy to aid in the detection of where the blockage has occurred, this process takes time to and time can be the difference in the survival of a patient. The main area for detection is in STEMI patients.
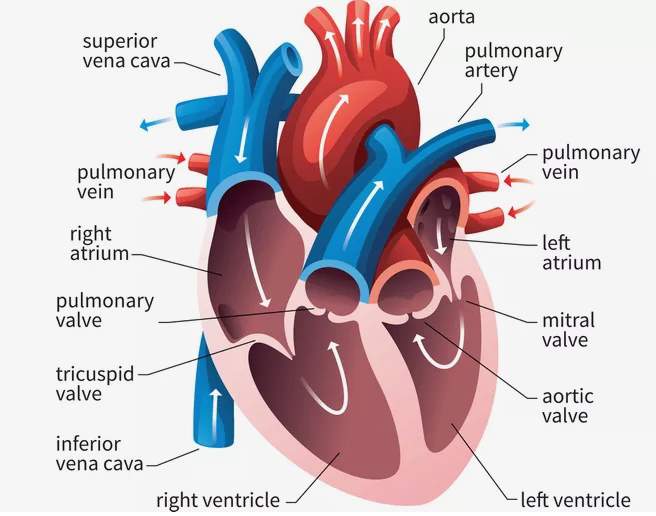
The heart is encased in a double-layered fibrous sac called the pericardium. The outer layer is a tough and fibrous connective tissue layer that prevents overdistension of the heart and anchors it within the mediastinum. The inner layer consists of simple squamous epithelium cells. Seeley, R. (2011). The heart consists of 4 chambers, the left and right atria and the left and right ventricles. The left side of the heart pumps oxygenated blood to the body and the right side of the heart pumps deoxygenated blood to the lungs. Because the left side has to pump blood further, the left side of the heart is more muscular, especially around the left ventricle.

Figure 1. Diagram of the heart [ThoughtCo. (2019)]
The atria receive blood via the veins. The right atrium receives deoxygenated blood from the superior and inferior vena cava, also it will receive blood from the smaller coronary sinus which carries blood from the walls of the heart to the right atrium. The left atrium receives oxygenated blood from the four pulmonary veins. [Seeley, R. (2011)] Blood leaves the left and right ventricles via the aorta and pulmonary arteries respectively.
The heart muscle receives blood via the coronary circulation it is transported by the coronary arteries to the walls of the heart muscle. The major vessels of the coronary circulation lie in grooves on the surface of the heart called the sulci. The major arteries supplying blood to the tissue of the heart lie within the coronary sulcus and the interventricular sulci. The right and left coronary arteries lie within the coronary sulcus. These can be differentiated due to the right coronary artery being smaller in diameter so therefore doesn't carry as much blood as the left coronary artery.
As previously stated, the right side of the heart carries deoxygenated blood to the through the pulmonary artery and delivers it to the lungs, once the blood has arrived at the lungs the carbon dioxide diffuses into the lungs and oxygen diffuses into the blood. The blood then travels along the pulmonary vein into the left side of the heart. This oxygenated blood is then pumped from the left side of the heart around the rest of the body where the oxygen diffuses into the surrounding muscles and carbon dioxide diffuses out and carried back to the right side of the heart.
The heart contains valves, which are designed to prevent backflow of the blood and ensure unidirectional flow, the first set of valves are located on the left and right atrium and are known as the Mitral and Tricuspid valves respectively, prevent backflow when the ventricles are being contracted and ensure that the blood is pumped out through the arteries ensuring a unidirectional flow. The second set of valves are located at the mouth of the aorta and pulmonary artery, these valves are known as the aortic and pulmonary valves respectively. The familiar lub-dub sound of the heart is created by the closing of the valves.

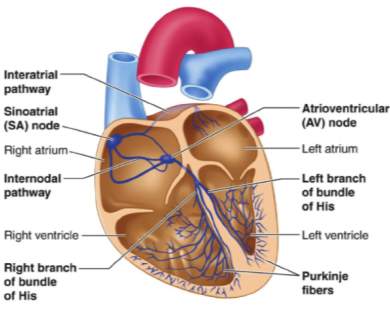
Figure 2. Electrical pathway of the heart. [Ganesan (2016)]
For the heart, to contract there are a series of electrical impulses that originate from the heart and travel through it enabling blood to be pumped around the body and to the lungs. The electrical impulse is known as an action potential, which originates from the sinoatrial (SA) node, also known as the pacemaker of the heart. The SA node spontaneously and more frequently generates action potentials than any other cardiac muscle cells. This action potential travels throughout both atria and across the wall of the atria to the atrioventricular (AV) node. Action potentials are conducted from the SA node to the AV node at a greater velocity than they are transmitted in the remainder of the atrial muscle fibres. Under resting conditions, it usually takes the heart 0.04 seconds to travel from the SA node to the AV node.
Action potentials are propagated slowly through the AV node, in comparison to the rest of the conduction system, this is due to the smaller-diameter muscle fibres and the intercalated disks having fewer gap junctions. Like other specialised conducting fibres in the heart, they have fewer myofibrils than most cardiac muscle cells. [Seeley, R. (2011)]. Due to this being a slower process it creates a delay of 0.11 seconds from the time the action potential reaches the AV node until they pass to the AV bundle. The delay of the action potentials at the AV node allows for the completion of the atrial contraction before a ventricular contraction begins. Once the action potential travels to the AV node it then travels down the through the fibrous skeleton, into the interventricular septum. The AV bundle divides into right and left bundle branches, and action potentials descend to the apex of each ventricle along the bundle branches.
From this point, the action potential travels along the Purkinje fibres up the side of the ventricle walls. The Purkinje fibres are large-diameter cardiac muscle fibres, they have fewer myofibrils than most cardiac muscle cells and do not contract as forcefully. Intercalated disks are well developed between the Purkinje fibres and contain numerous gap junctions. As a result of these structural modifications, action potentials travel along the Purkinje fibres much more rapidly than in other cardiac muscles. [Seeley, R. (2011)]. The action potential starts the contraction from the base of the septum to ensure that the blood is forced up and through the arteries.
When action potentials are conducted through the heart electrical signals that can be measured at the body surface. This can be detected by the use of electrodes that are placed at specific points on the body and are linked to a machine that can detect the small changes in voltage and record them, giving a visual output of the action potentials as it travels through the heart. This is not a recording of one action potential rather a summation of all the action potentials transmitted at a given time by cardiac muscle cells. The summated record of the cardiac action potentials is referred to as an electrocardiogram (ECG). [Seeley, R. (2011)].
The ECG is not a direct measurement of mechanical events in the heart, it is unable to provide information about how strong the contraction was or what the patient's blood pressure is. However, it is still a valuable piece of technology as it can help determine the mechanical properties as each electrical impulse correlates with a mechanical event. When working with an ECG and knowing the correlating mechanical events an ECG can be beneficial is diagnosing any abnormalities in the rhythm of the heart, as well as the rate at which the heart is working. The benefits of using an ECG to help in the determination of these abnormalities is that it is a painless, non-invasive technique that can provide real-time analysis.

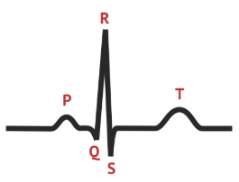
Figure 3. Typical ECG Trace. Medschool.co. (2019).
The figure above represents a typical ECG tracing. A normal ECG tracing consists of a P wave, a QRS Complex and a T wave, each of these stages represent important electrical changes of the heart. ECG machine runs at a standard rate of 25mm/s and uses paper with standard size squares. Each large square represents 0.2 seconds (200 milliseconds (ms)). Therefore, there are five larger squares per second, and 300 per minute. So, an ECG event such as the QRS complex, occurring once per large square is occurring at a rate of 300/min.[Hampton, J. (2019)].
The P wave indicates the depolarization of the atrial myocardium, signals the beginning of atrial contraction. The QRS complex indicates the ventricular depolarization and the beginning of ventricular contraction and finally, the T wave represents the repolarisation of the ventricles and precedes ventricular relaxation. There is no wave representing the repolarisation of the atria due to it occurring simultaneously with the QRS complex so is hidden in the graphical display.
Due to the ECG being a graphical representation, it enables time intervals to be determined. The time between the P wave and the QRS complex is the PQ interval, this tends to be referred to as the PR interval due to the Q wave being so small and the R wave being easier to detect. This interval tends to last 0.16 seconds, this is the time taken for the excitation to travel from the SA node, through the atrial muscle and the AV node, down the bundle of his and into the ventricular muscle, in mechanical terms in this time the atria contract and begin to relax. The ventricles begin to depolarise at the end of the PR interval. The next interval on the ECG is the QT interval, this extends from the Q wave/ start of the QRS complex to the end of the T wave, lasting approximately 0.36 seconds. This varies with the heart rate of the patient; it can be prolonged in patients with some electrolyte abnormalities or by the use of certain drugs. A prolonged QT interval can lead to ventricular tachycardia. In this interval the ventricles contract and begin to relax. [Hampton, J. (2019)]. The QRS complex indicates the time taken for the excitation to travel through the ventricles, the duration is usually 120ms or less, but if this period is longer it is an indication of abnormalities.
To allow a 3-dimensional look at the electrical activity of the heart a 12 lead ECG is used. There are 12 leads that all look at the heart from different angles to get the most accurate representation of the condition of the heart. The leads are all specifically labelled; Lead I, II, III, aVL, aVR, aVF, V1, V2, V3, V4, V5 and V6. The arrangement of the leads allows for different views of the heart: leads II, III, and aVF view the inferior surface of the heart; leads V1 to V4 view the anterior surface; leads I, aVL, V5, and V6 view the lateral surface; and leads V1 and aVR look through the right atrium directly into the cavity of the left ventricle. [Meek, S. and Morris, F. (2019)].
As previously stated the ECG can help in the detection of abnormalities, this includes one of the major killers in the UK, heart disease. Heart disease can occur in different ways and affect different areas of the heart. Some diseases are due to deformities of the heart that have been present since birth which is known as congenital heart disease, this condition will be diagnosed in 13 babies per day in the UK with more diagnoses later in life. [Bhf.org.uk. (2019)]. Other diseases can be developed due to lifestyle and environmental factors, such as coronary artery disease (CAD). Coronary artery disease is the collective term for diseases that occur whenever the artery supplying the oxygen supply to the heart is compromised by plaque. This plaque narrows the lumen of the artery which in turn reduces coronary blood flow and causes inappropriate vasoconstriction of the coronary resistance vessels, [Lilly, L. (2016)]. Coronary artery disease can also be known as coronary heart disease or ischaemic heart disease. There doesn't tend to be any symptoms and people may be unaware they have it, but can lead to life-threatening issues such as angina (tight chest pains that may precede a heart attack), heart attacks (blood supply to your heart is blocked), strokes (blood supply to your brain is blocked), transient ischaemic attacks (TIAs) (temporary symptoms of a stroke) or peripheral arterial disease (blood supply to legs is blocked) [nhs.uk. (2019)].
Heart disease is a major issue in today's society with "more than 1.4 million people are admitted to hospitals in the United States each year with Acute Coronary Syndromes (ACS). Within the year after the first MI, 19% of men and 26% of women will die." – Pathophysiology of Heart Disease (2016) [Lilly, L. (2016)]. Today in the UK, 470 people will die from heart or circulatory diseases, and more than 120 of those people will be below the age of 75, classified as premature deaths due to heart conditions. There are currently more than 7.4 million people living with heart or circulatory disease. [Bhf.org.uk. (2019)].
Currently, several treatment methods are using pharmacologic agents or surgical intervention and also lifestyle changes. If any symptoms arise the first steps that should be implemented is the lifestyle changes, this uses data which convincingly demonstrates the benefit in the cessation of smoking, the lowering of cholesterol in the diet and the control of the blood pressure will all lower the risk of coronary disease events. [Lilly, L. (2016)]. The next level of treatment would be the use of pharmacologic agents; this involves treatment using nitrates, β-blockers and antiplatelet therapy. Nitrates help with the treatment of angina and work by dilating the arteries and veins in the body, this reduces stress on the heart and improves blood flow to the heart relieving the angina symptoms. Bhf.org.uk. (2019). β-blockers work by reducing blood pressure. They do this by blocking the release of the stress hormone adrenaline and noradrenaline in certain parts of the body which then results in slowing the heart rate and in turn reduces the force at which blood is pumped around your body. Bhf.org.uk. (2019). Antiplatelet therapy is used for patients with chronic angina and reduces the risk of further ACS's, this therapy should be standard practice in the treatment of CAD. [Lilly, L. (2016)].
For some patients' medication might not be enough and if this is the case surgical intervention is the next step. This can be done via coronary angioplasty and stents or heart bypass surgery. Coronary angioplasty and stents are a treatment where a balloon is inserted into the artery via the arm or groin and using a guidewire is guided to the blockage. Once located at the blockage the balloon is gently inflated to relieve the pressure on the heart, as soon as the balloon is inflated a stent can be inserted to prevent the blockage from reoccurring. This process is an emergency treatment for people who have just experienced a heart attack. The final treatment method is coronary bypass surgery, this can be performed on a patient with angina or coronary heart disease to improve their quality of life. The process involves the surgeon using a blood vessel in your leg arm or chest to bypass the narrowed section of the artery.
ECG's can give a variety of different signs that are associated with myocardial ischaemia, such as cardiac arrhythmias, intraventricular bundle branch blocks, atrioventricular conduction delays or loss of precordial R wave amplitude. [Thygesen, K. (2018)]. An ECG can only give signs that may indicate towards myocardial ischaemia or infarction, as changes to the ST segment can also be present in other conditions such as; acute pericarditis, LV hypertrophy, Brugada syndrome or early repolarisation patterns, prevent these conditions from being confused with new conditions a prior ECG reading is often helpful.
Another disease that can be indicated on the ECG is prolonged new convex ST-segment elevation with reciprocal ST-segment depression, this usually reflects acute coronary occlusion which can result in myocardial damage with necrosis. Reciprocal changes can help to differentiate between STEMI and pericarditis or early repolarization changes. [Thygesen, K. (2018)].
Some of the earlier manifestations of myocardial ischaemia are typical T wave and ST-segment changes. Increased hyperacute T wave amplitude with prominent symmetrical T waves in at least 2 contiguous leads is an early sign that may precede the elevation of the ST segment. Development of new Q waves may indicate myocardial necrosis, which starts minutes/hours after the myocardial insult. [Thygesen, K. (2018)].
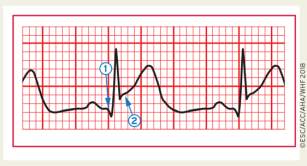
As shown in Figure 4, the J-point is the section just after the QRS complex indicated by the number 2. The difference between the onset of the Q wave (number 1) and the J-point (number 2) enables the identification of the magnitude of displacement. [Thygesen, K. (2018)].

Figure 4. ECG example of ST-segment elevation. [Thygesen, K. (2018)].
New or presumed new J-point elevation >=1mm (1mm = 0.1mV) is required in all leads other than V2 and V3 as an ischaemic response. In healthy men under 40, J-point elevation can be as much as 2.5mm in leads V2 or V3 but decreases with age. [Thygesen, K. (2018)].The sex of the patient can also require different cut-off values as the J-point elevation in healthy women in leads V2 and V3 are less than men. The criteria in Table 2 require that the ST shift be present in two or more contiguous leads. [Thygesen, K. (2018)]
For example, >=2mm of ST-elevation in lead V2 and >=1mm in lead V1 - Meets criteria of 2 abnormal contiguous leads >40-year-old man. However, >=1mm and
ST-elevation in lead aVR > 1mm may accompany anterior or inferior STEMI and is associated with increased 30-day mortality in patients with acute MI. [Thygesen, K. (2018)].
These measurements are all taken by a doctor when reading the ECG, to make diagnosis quicker and more accurate a software program could be programmed to read these changes and be able to display the diagnosis when the patient is connected to the ECG machine. For this to occur the software that will be used will be MATLAB.
MATLAB® is a programming platform designed specifically for engineers and scientists. The heart of MATLAB is the MATLAB language, a matrix-based language allowing the most natural expression of computational mathematics. Using MATLAB, you can analyse data, develop algorithms, and create models and applications. [Uk.mathworks.com. (2019)]
For the ECG to be able to help with providing diagnosis, the ECG must be recorded and stored in memory. MATLAB will read in the information from the ECG and before processing any of the information it will remove any noise from the ECG. The computer must then insert markers to know where to detect the where the various wave components are located. After the ECG has been cleaned of any noise and the waves have been located a rule-based algorithm must decide if the measurements meet the defined criteria for STEMI as stated above previously.
References
- Bhf.org.uk. (2019). Angina medication: Questions about nitrates answered. [online] Available at: https://www.bhf.org.uk/informationsupport/heart-matters-magazine/medical/drug-cabinet/nitrates [Accessed 23 Dec. 2019].
- Bhf.org.uk. (2019). Heart statistics. [online] Available at: https://www.bhf.org.uk/what-we-do/our-research/heart-statistics [Accessed 23 Dec. 2019].
- Bhf.org.uk. (2019). Watch: What are beta blockers and what do they do in your body?. [online] Available at: https://www.bhf.org.uk/informationsupport/heart-matters-magazine/medical/drug-cabinet/beta-blockers [Accessed 23 Dec. 2019].
- Ganesan, Prasanth & Sterling, Mark & Ladavich, Steven & Ghoraani, Behnaz. (2016). Computer-Aided Clinical Decision Support Systems for Atrial Fibrillation. 10.5772/65620.
- Hampton, J. (2019). The ECG Made Easy. 7th ed. London: Elsevier, pp.6, 9.
- Lilly, L. (2016). Pathophysiology of Heart Disease. 6th ed. pp.153, 162, 167.
- Medschool.co. (2019). The Normal ECG Trace. [online] Available at: https://medschool.co/tests/ecgbasics/the-normal-ecg-trace [Accessed 23 Dec. 2019].
- Meek, S. and Morris, F. (2019). Introduction. I—Leads, rate, rhythm, and cardiac axis. [ebook] British Medical Journal, p.Page 2. Available at: https://www.ncbi.nlm.nih.gov/pmc/articles/PMC1122339/pdf/415.pdf [Accessed 23 Dec. 2019].
- NHS.uk. (2019). Atherosclerosis (arteriosclerosis). [online] Available at: https://www.nhs.uk/conditions/atherosclerosis/ [Accessed 23 Dec. 2019].
- Seeley, R. (2011). Seeley's anatomy & physiology. 11th ed. New York, NY: McGraw-Hill, pp.676, 678, 685, 686, 691.
- ThoughtCo. (2019). How the Human Heart Evolved Four Chambers. [online] Available at: https://www.thoughtco.com/evolution-of-the-human-heart-1224781 [Accessed 23 Dec. 2019].
- Thygesen, K. (2018). Fourth universal definition of myocardial infarction. [ebook] Available at: https://www.scholars.northwestern.edu/en/publications/fourth-universal-definition-of-myocardial-infarction-2018-2 [Accessed 23 Dec. 2019].
- Uk.mathworks.com. (2019). What is MATLAB?. [online] Available at: https://uk.mathworks.com/discovery/what-is-matlab.html [Accessed 23 Dec. 2019].
Cite This Work
To export a reference to this article please select a referencing style below:

